« The Orbitofrontal Cortex, Regret and Decision Formation | Main | The Social Dilemma of Exaggerating the Positive »
August 11, 2004
IQ or Financial Incentives?
HOW FINANCIAL INCENTIVES AND COGNITIVE ABILITIES AFFECT TASK PERFORMANCE IN LABORATORY SETTINGS
Ondrej Rydval and Andreas Ortmann have a paper forthcoming in Economic Letters in which they re-analyze some data from Gneezy and Rustichini (2000) and look at the relative importance of financial incentives and cognitive capabilities on reasoning tasks.

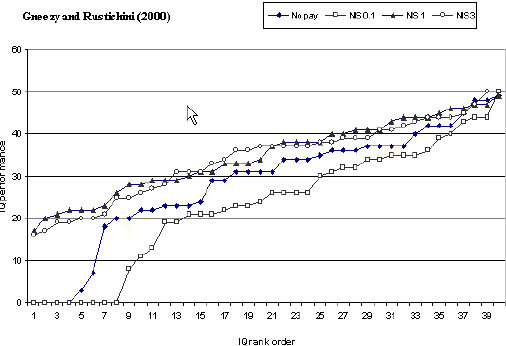
The various NIS levels reflect the level of payment incentive (New Israeli Shekels, get it?) used by Gneezy and Rustichini (2000).
Rydval and Ortmann give the following interpretation:
"First of all, notice that the performance curves for the high-incentive treatments (NIS1 and NIS3) are virtually identical and slope considerably upwards, implying that there is a high within-treatment variation in performance but hardly any across-treatment one. Arguably, this is most likely due to a significant within-treatment variation in cognitive abilities. One could conceive that the large within-treatment performance variation is partly also effort-driven, but the variation in cognitive effort required to generate this result is unlikely; plus one would need to explain why the two performance curves seem almost identical despite the across-treatment incentive (and thus presumably effort) differential. Therefore, consistent with the interpretation of the IQ score as ability rank, it seems quite plausible that ability rather than incentive differentials determine individual performance differentials when incentives are high enough.
Next inspect the performance curves for the low-incentive treatments (no-pay and NIS0.1). Clearly, Gneezy and Rustichini (2000) were right in asserting that the NIS0.1 subjects overall were less motivated than the ones in the no-pay treatment. This is particularly apparent at the low-performance end where the gap between the performance curves for the low-incentive treatments widens (and, in addition, so does the gap between the performance curves of the two low-incentive treatments and the two high-inventive treatments). That the NIS0.1 subjects were less motivated than the ones in the no-pay treatment also seems confirmed by the performance curve for the NIS0.1 treatment lying below that for the no-pay treatment across the whole performance range. It is highly unlikely that this would be caused by across-treatment ability differentials, and thus across-treatment differences in motivation must have played the main role.
Finally and most importantly, focus on the slope of all four performance curves and the distance between them. An eyeball test reveals that, leaving aside the motivational problems at the low-performance end, the within-treatment variation in performance is generally much greater than the variation across treatments. To give a meaningful comparison, consider the largest across-treatment performance differential at the median rank. This turns out to be 13 (i.e., 24 correct answers in the NIS0.1 treatment vs. 37 in the NIS1 treatment), which is equivalent to the performance differential associated with moving up from the first to the third quartile within the NIS1 treatment (28 vs. 41). Note, however, that within-treatment performance differentials can be much larger. For instance, in both of the high-incentive treatments (NIS1 & NIS3), the difference in performance for individuals ranked 1 and 40 is as large as 34."
Reference
Gneezy, U. & Rustichini, A. (2000). Pay enough or don't pay at all, Quarterly Journal of Economics 115, 791-811.
Posted by dggoldst at August 11, 2004 10:43 AM